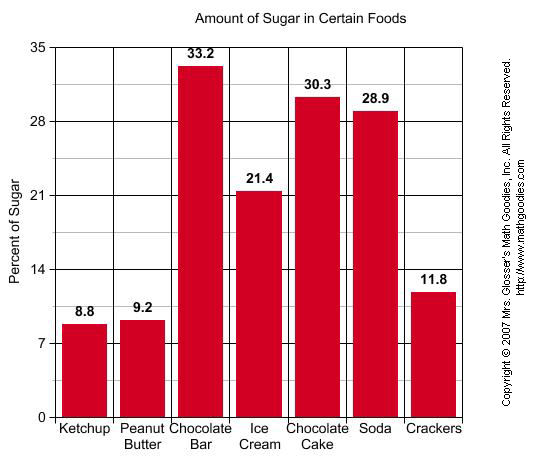
Here are some examples of bar graphs to give a visual of what they can look like.


Notice the bar graphs above show a title, labels, and a consistent way of measuring the data. The main difference between bar graphs and histograms is that the bars do not touch because of the nature of the data collected. In my opinion I think a bar graph is easier to read then a pictograph.
Bar graphs are best to use when the mean and median cannot be found due to the data collected. Lastly, I wanted to point out that a bar graph can be transformed into a pie chart. Just by cutting the bars out, taping them, and tracing the circle with values for each.
(Here is a fun activity for your students to play that goes off of what I have explained about statistics using bar graphs.) Create a graph classic
Blogroll:
Bar Graphs
Pie Chart or Bar Graph
Creating Bar Graphs
Line or Bar Graph
Coolness Graphed
Tags:
Review of Bar graphs
Math goodies
Create a graph
Bar Graph worksheets
Learn about bar graphs
Kayla,
ReplyDeleteWow I really like your blog overall it is very neat and organized. I especially like this post about bar graphs. You explained the difference of a bar graph and a histogram which is very important. What I loved the most were your hyperlinks; for example your hyperlink with the word categorical and how it led to a page explaining categorical was awesome!
Great job!